W-2 vs 1099 in Emergency Medicine: How Much More Does 1099 Pay?
Matthew Behrens, MD
Among 632 submissions, the median W-2 rate is $245/hr and the median 1099 rate is $290/hr. That's a difference of $45/hr, or 18%.
| Hourly rate band | W-2 submissions | 1099 submissions |
|---|---|---|
| ≤ $180 | 12 | 5 |
| $180–$200 | 30 | 8 |
| $200–$220 | 46 | 14 |
| $220–$240 | 52 | 24 |
| $240–$260 | 57 | 54 |
| $260–$280 | 49 | 41 |
| $280–$300 | 23 | 24 |
| $300–$320 | 18 | 69 |
| $320–$340 | 9 | 39 |
| $340–$360 | 7 | 28 |
| $360–$420 | 5 | 13 |
| ≥ $420 | 0 | 3 |
Unsurprisingly, 1099 compensation skews higher than W-2. Physicians expect to be compensated at a higher rate as 1099 to cover for the employer's share of payroll tax and benefits. But, the overlap between the two is also significant. 15% of W-2 rates are above the median 1099 rate and 19% of 1099 rates fall below the median W-2. Making matters more complicated, the $45 from the national sample is the effect of multiple factors. Jobs that are harder to fill, and thus more likely to be higher paying, are disproportionately 1099 because of the use of agencies and per diem workers. How much of the 1099 premium relative to W-2 is attributable to the contract type rather than location? Are there markets where 1099 offers a greater premium than others?
Each dot is that region's own difference; the bar is a 95% interval.
| Cohort | Gap | 95% interval | W-2 submissions | 1099 submissions | Differs from the national gap |
|---|---|---|---|---|---|
| Northeast | +$45 | +$25 to +$80 | 101 | 59 | no |
| Midwest | +$40 | $0 to +$55 | 55 | 48 | no |
| South | +$50 | +$25 to +$55 | 100 | 126 | no |
| West | +$30 | +$5 to +$45 | 52 | 88 | no |
Every region's 1099 to W-2 comparison overlaps with one another and the national number. The premium for 1099 appears flat across regions.
The gap runs from $90 in Illinois down to $10 in North Carolina. While this initially sounds like a significant finding, I suspect this is actually an artifact of distribution rather than a premium unique to its job market. In the widest state, Illinois, there's a clear example. 100% of the W-2 reports come from metropolitan ZIP codes, against 40% of the 1099 reports. In order to separate the premium earned from contract type, we have to compare 1099 and W-2 rates from similar population densities as well as broader market.
Matching on state and population density, so rural 1099 is compared to rural W-2, the pooled gap falls to $35/hr. This is $10/hr below the national figure.
My initial hypothesis was that the gap between 1099 and W-2 would be widest in rural areas and smallest metros. Rural and micropolitan departments are the ones that struggle to staff their schedule, so aren't they paying more to their contractors than their employed staff?
Metropolitan, micropolitan and rural are USDA Rural-Urban Commuting Area classifications, resolved from the submitted ZIP. The dashed line is the national gap.
| Cohort | Gap | 95% interval | W-2 submissions | 1099 submissions | Differs from the national gap |
|---|---|---|---|---|---|
| Metropolitan | +$40 | +$25 to +$55 | 262 | 230 | no |
| Micropolitan | +$35 | +$25 to +$50 | 24 | 52 | no |
| Rural | +$45 | −$10 to +$80 | 19 | 37 | no |
At least according to the Moonlighter dataset, they are not. All three intervals cover the national figure, and the point estimates sit within a few dollars of each other. The premium is close to flat across the whole country.
What density does change is who holds which contract. 47% of metropolitan submissions are 1099 versus 67% outside metropolitan areas. The previous post, Emergency Medicine Physician Salaries: Does Where You Work Matter?, shows how micropolitan markets pay a premium relative to rural and metropolitan markets. This is why the raw gap runs above every geography-matched one.
A W-2 employer pays half your Social Security and Medicare tax on top of your wage. While an employee never sees that money, a 1099 physician has to pay both halves instead.
Across the W-2 submissions here, the employer's share works out to a median of $10.86/hr, about 4.5%. The 6.2% employer half of Social Security caps out partway through an emergency medicine physician's year and only the uncapped 1.45% Medicare portion applies above it. My conclusion is that what remains after correction for the location premium and tax-withholding is the value that the benefits have to exceed to break even.
There are a number of physicians in the Moonlighter dataset that submitted both W-2 and 1099 income, myself included. Of the 13 that reported two contract types, 10 reported earning more in their 1099 with a median difference of $85/hr.
Each physician contributes one number equaling the difference betwenn their 1099 and w-2 rates, The bar spans the middle 50%; the tick is the median.
| Cohort | 10th pct | 25th pct | Median | 75th pct | 90th pct | n |
|---|---|---|---|---|---|---|
| Same physician | not published at this cohort size | $40 | $85 | $105 | not published at this cohort size | 13 |
Working a W-2 job for benefits and 1099 job for additional income is a common pattern for EM physicians. Within the dataset, the sample size is small and not random. The wider gap likely reflects the self selected nature of the cohort. Any 1099 job has to clear the opportunity cost of additional W-2 work plus the inconvenience of travel and multiple schedules.
As it turns out, it depends. The gap between 1099 and W-2 at the national level is $45/hr. Controlling for uneven distribution in location removes $10/hr, resolving to $35/hr. The value of W-2 employer tax withholding removes another $10.86/hr, leaving $24/hr remaining. This is the number that the value of employer provided benefits has to surpass in order to break even with the average premium applied to 1099. Assuming you work 1,440 hours per year, 120 hours per month, your employer benefits have to be greater than $34,560 per year.
Want to compare your salary to another contract type?
Sets the per hour value of anything quoted annually
Health premium the employer pays, retirement match, CME, and the cash value of paid time off.
The 632 submissions used for the figures in this post are NPI-verified, self-selected submissions, not a random sample of EM physician salaries and subject to the biases therein.
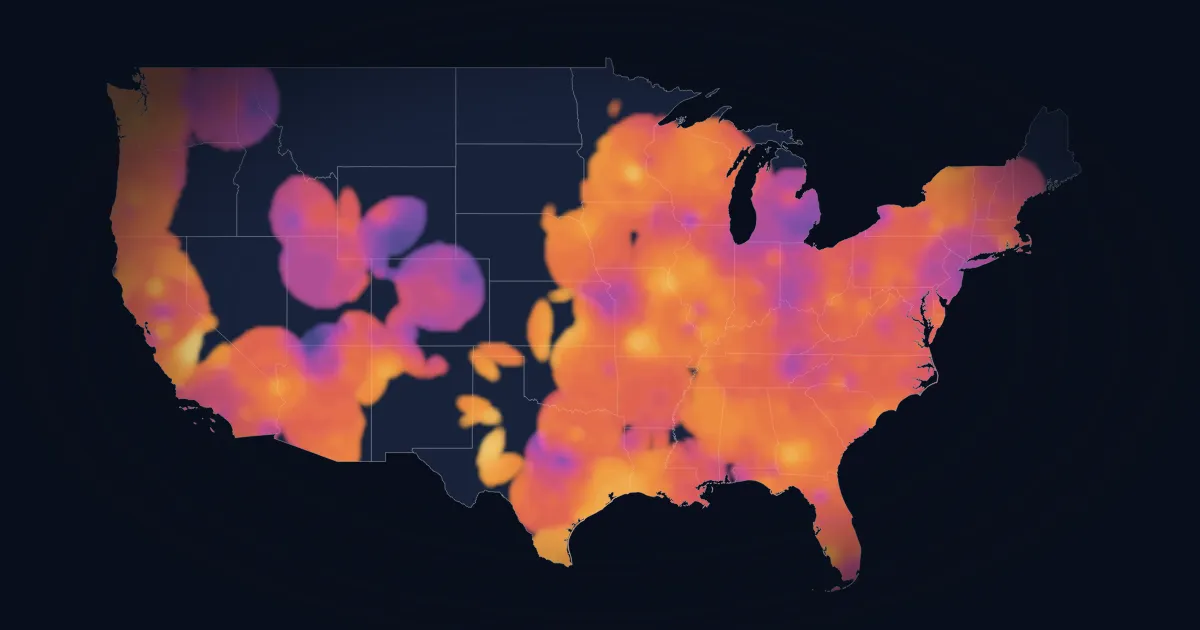
Moonlighter is a physician-built platform for emergency medicine physicians to share what they are actually paid. If you're an emergency medicine physician and would like to see the map, create an account below.